
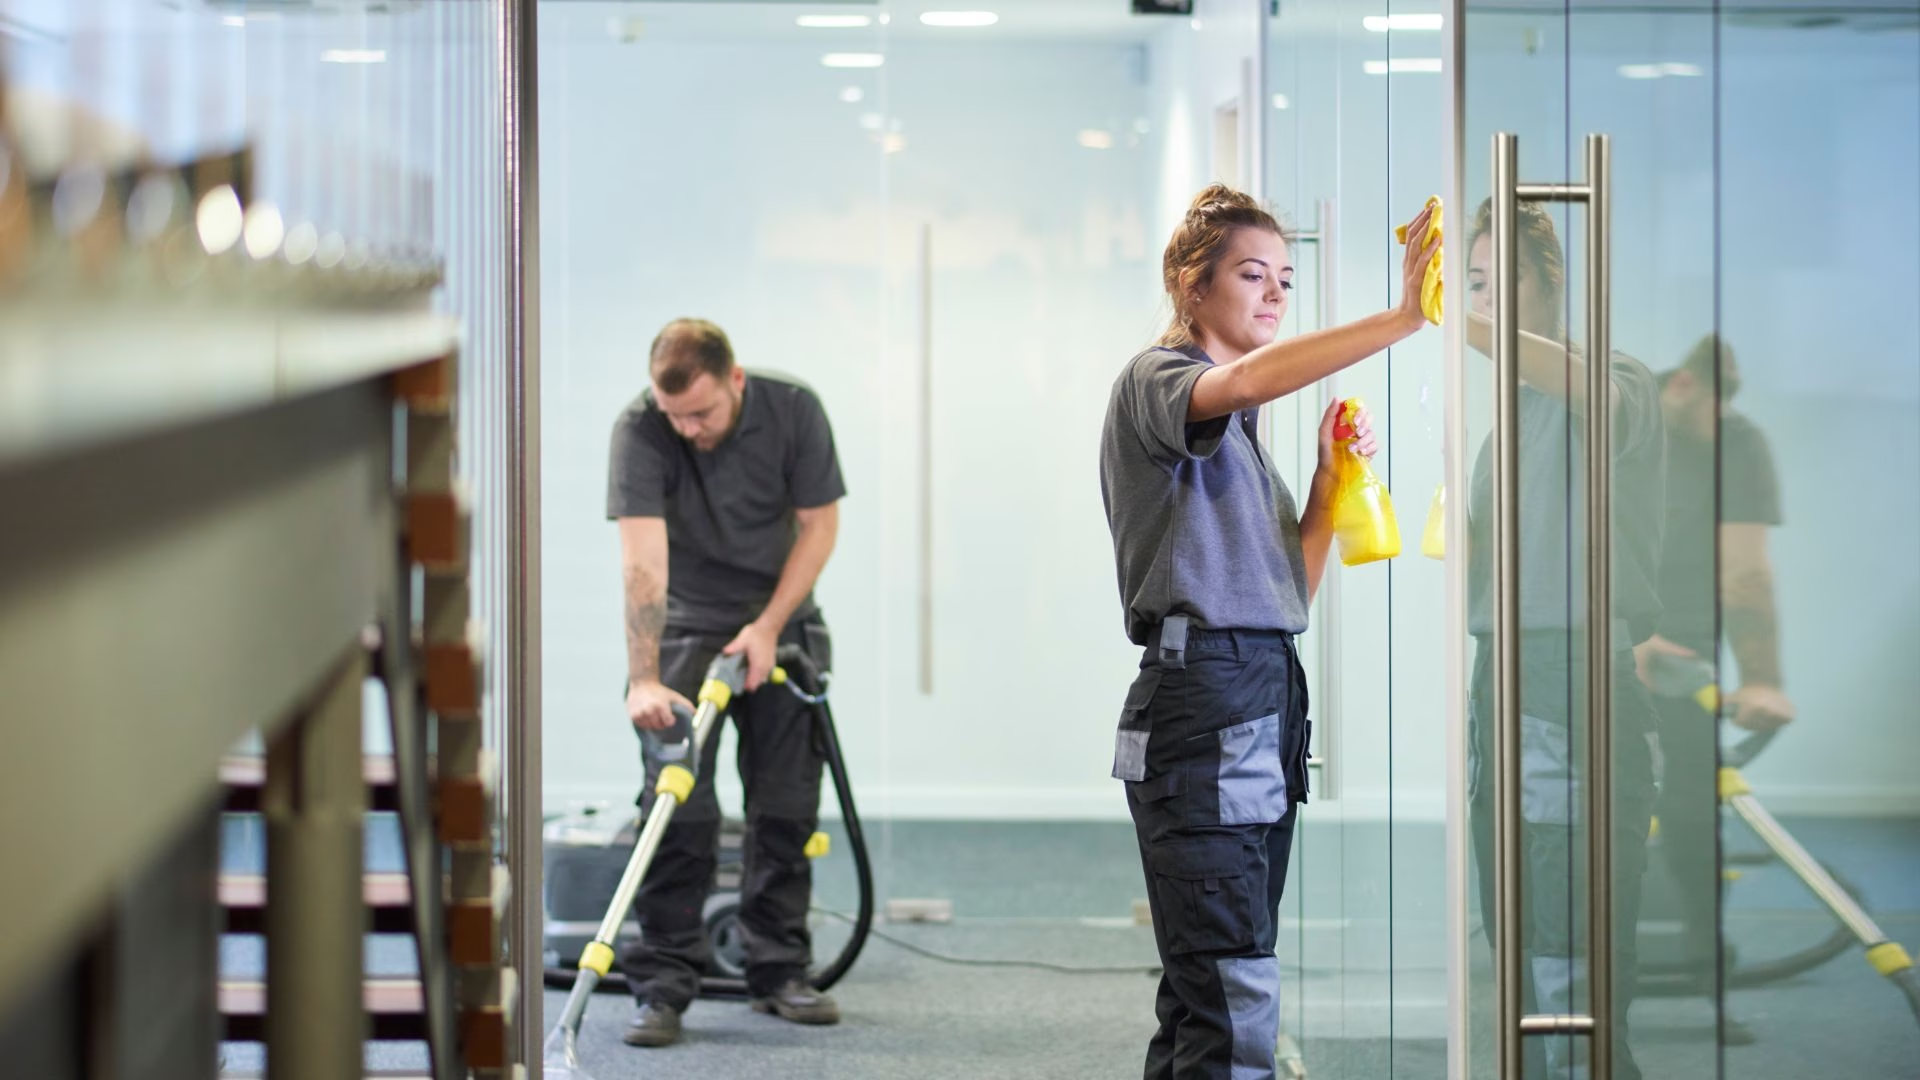
Commercial Cleaning
Prove completed work, standardise quality checks and give clients reliable evidence across every contract.
Workflow · Cleaning operations
Make cleaning measurable from assignment to approval. The workflow coordinates photo capture, verification, decision rules, rework and an audit-ready trail in one proof-of-clean process.
Powered by Cleanliness Evaluator and Visual Reference Agent
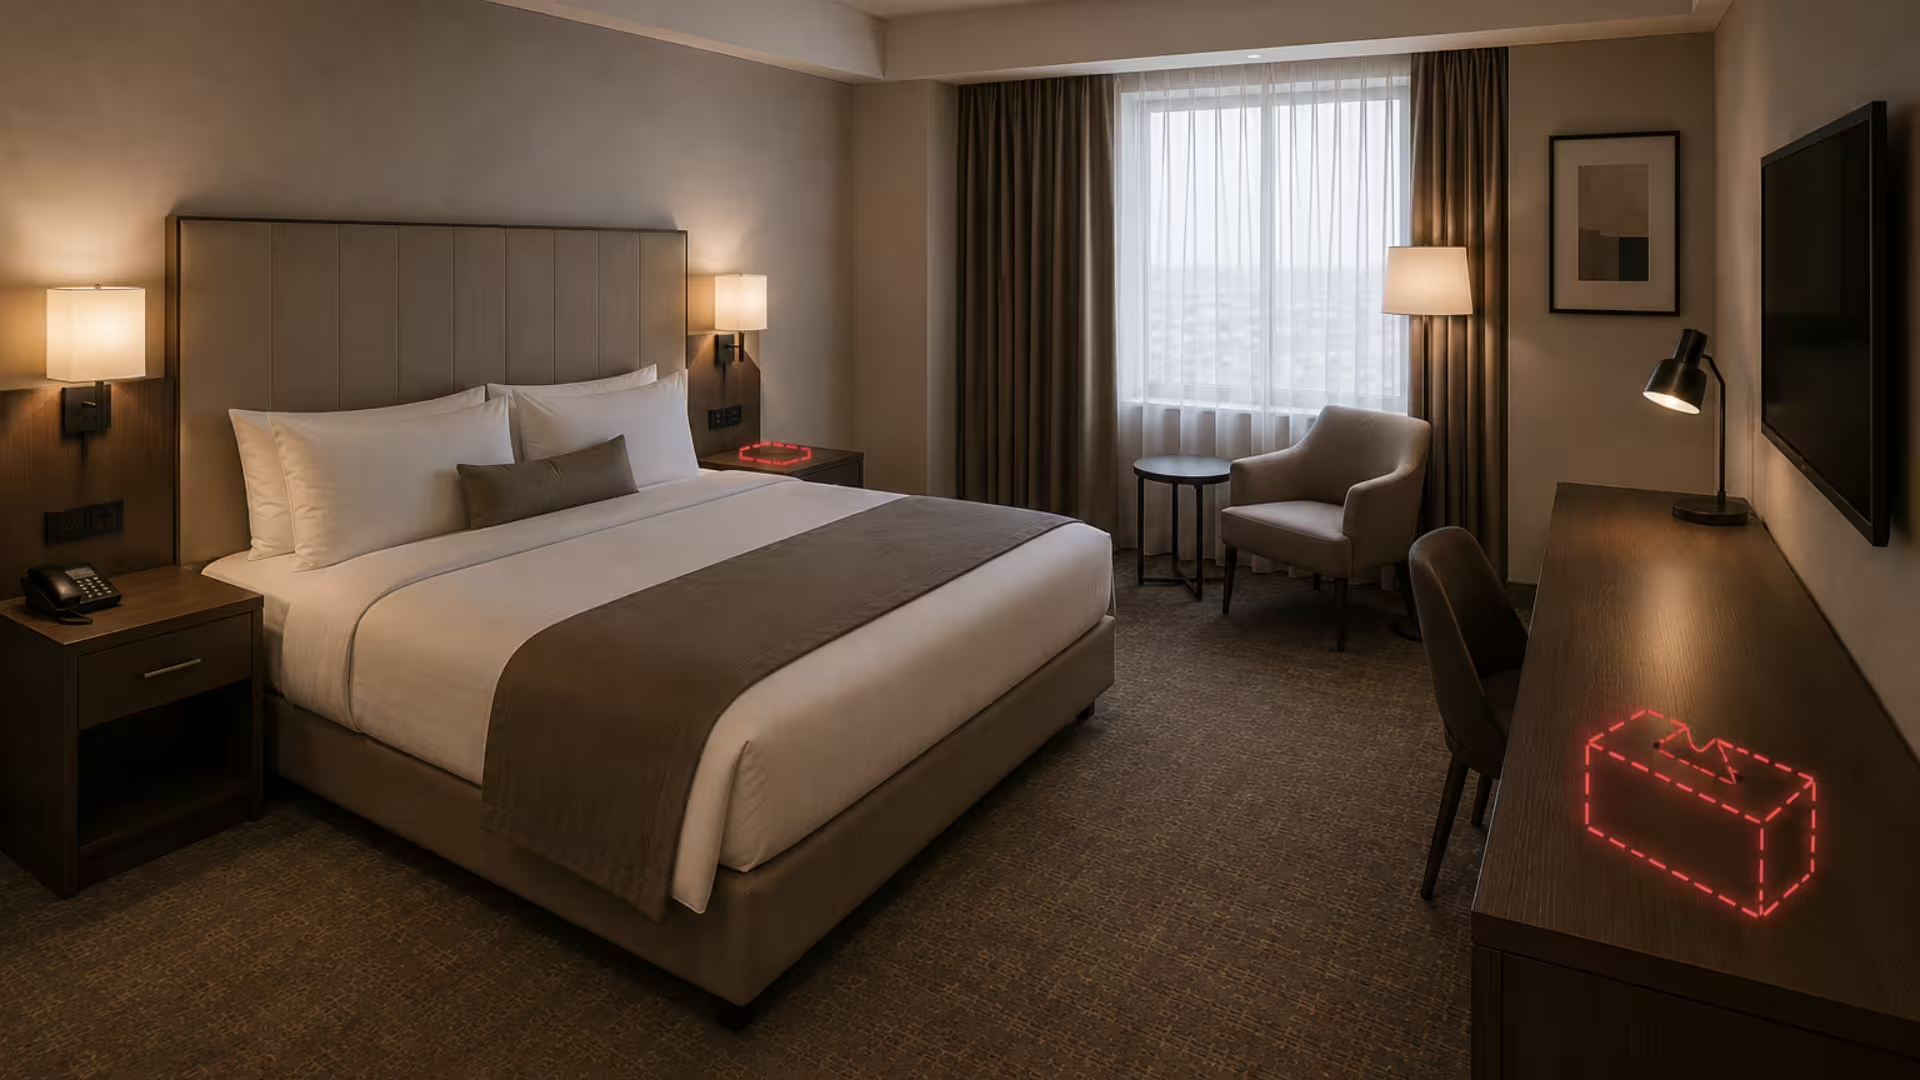 Linen · Clean2 amenities missing
Audit result
3/5
Below standard – rework assigned before check-in
How it works
Assign inspections, capture evidence, verify results with Vision Agents and automatically trigger the next operational action.
The workflow handles assignment, capture, decision rules and the audit trail. The assessment itself is done by theAI cleanliness evaluator, which reads each submitted image and returns the findings this workflow acts on.
AI cleanliness evaluator →Apply consistent standards across teams, locations and contracts without adding complex equipment or manual reporting.
Prove completed work, standardise quality checks and give clients reliable evidence across every contract.
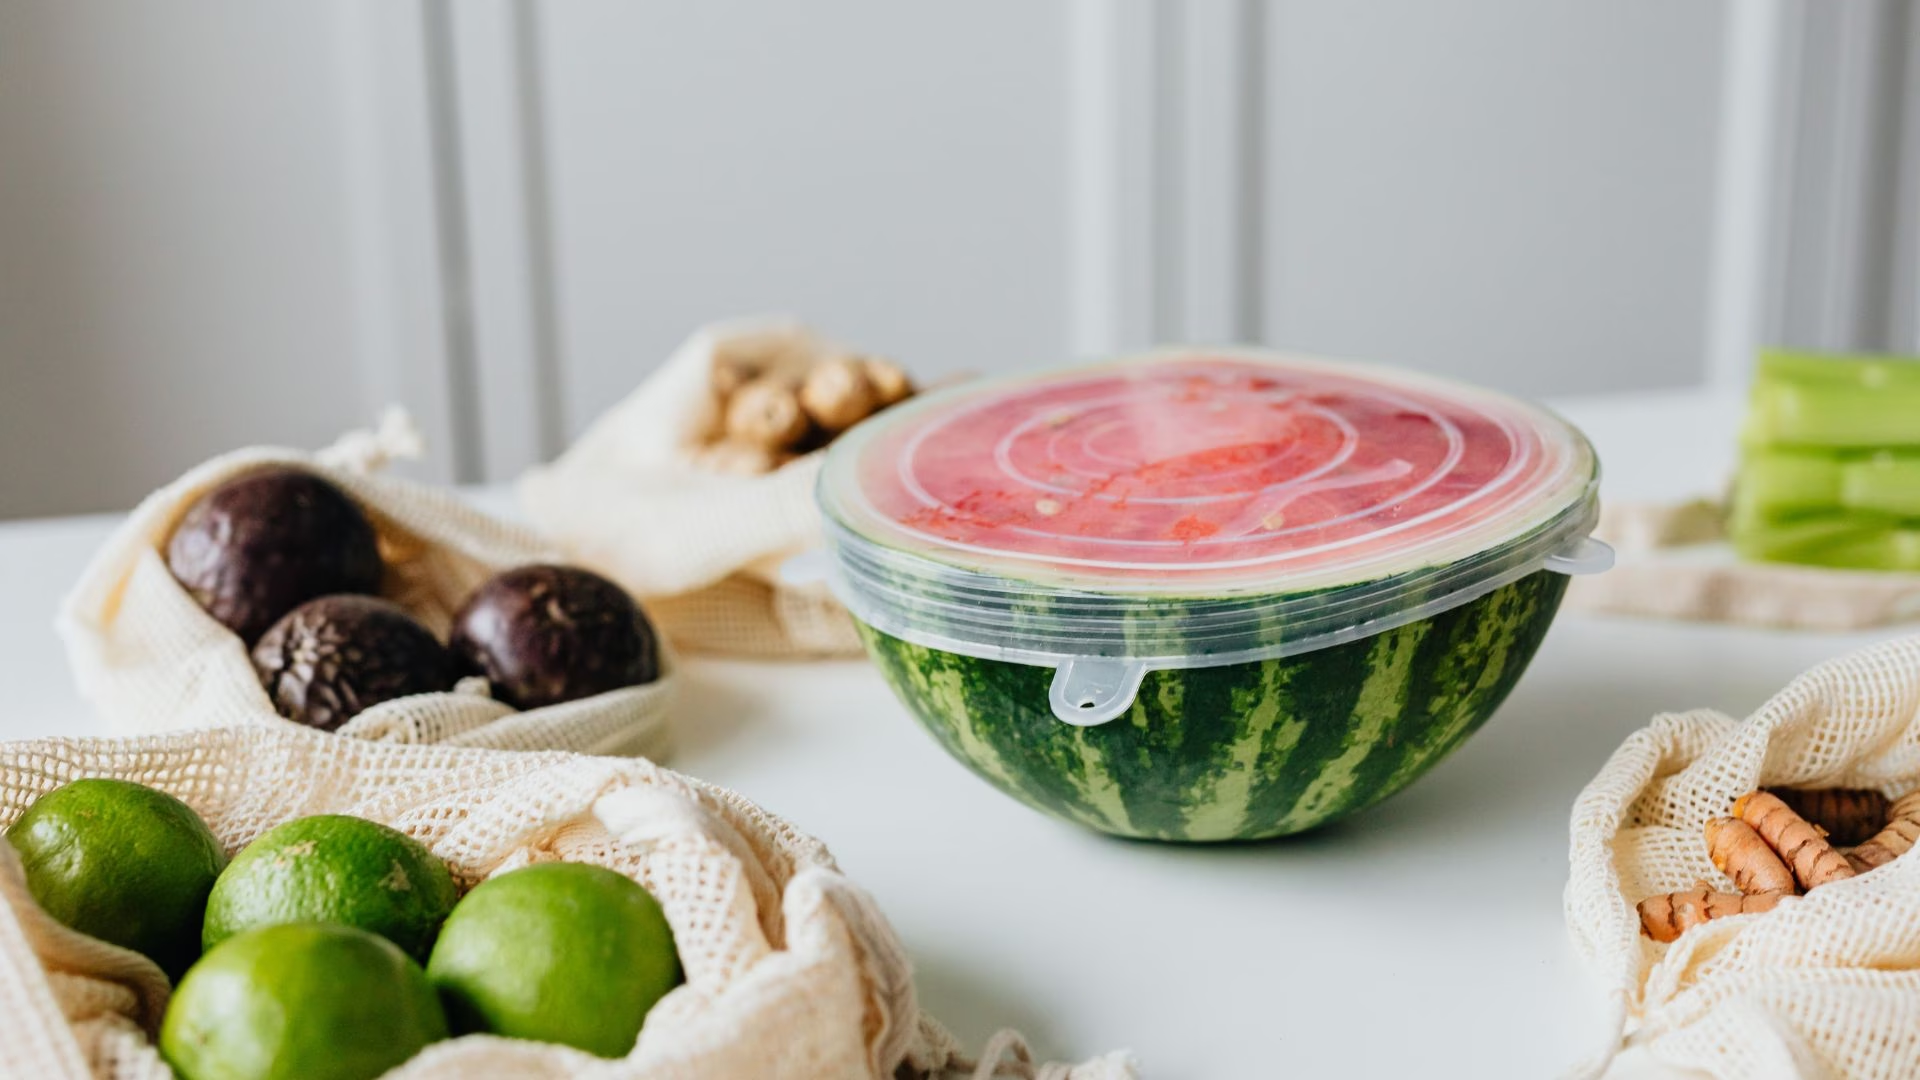
Maintain consistent standards across stores, departments and high-traffic customer areas.
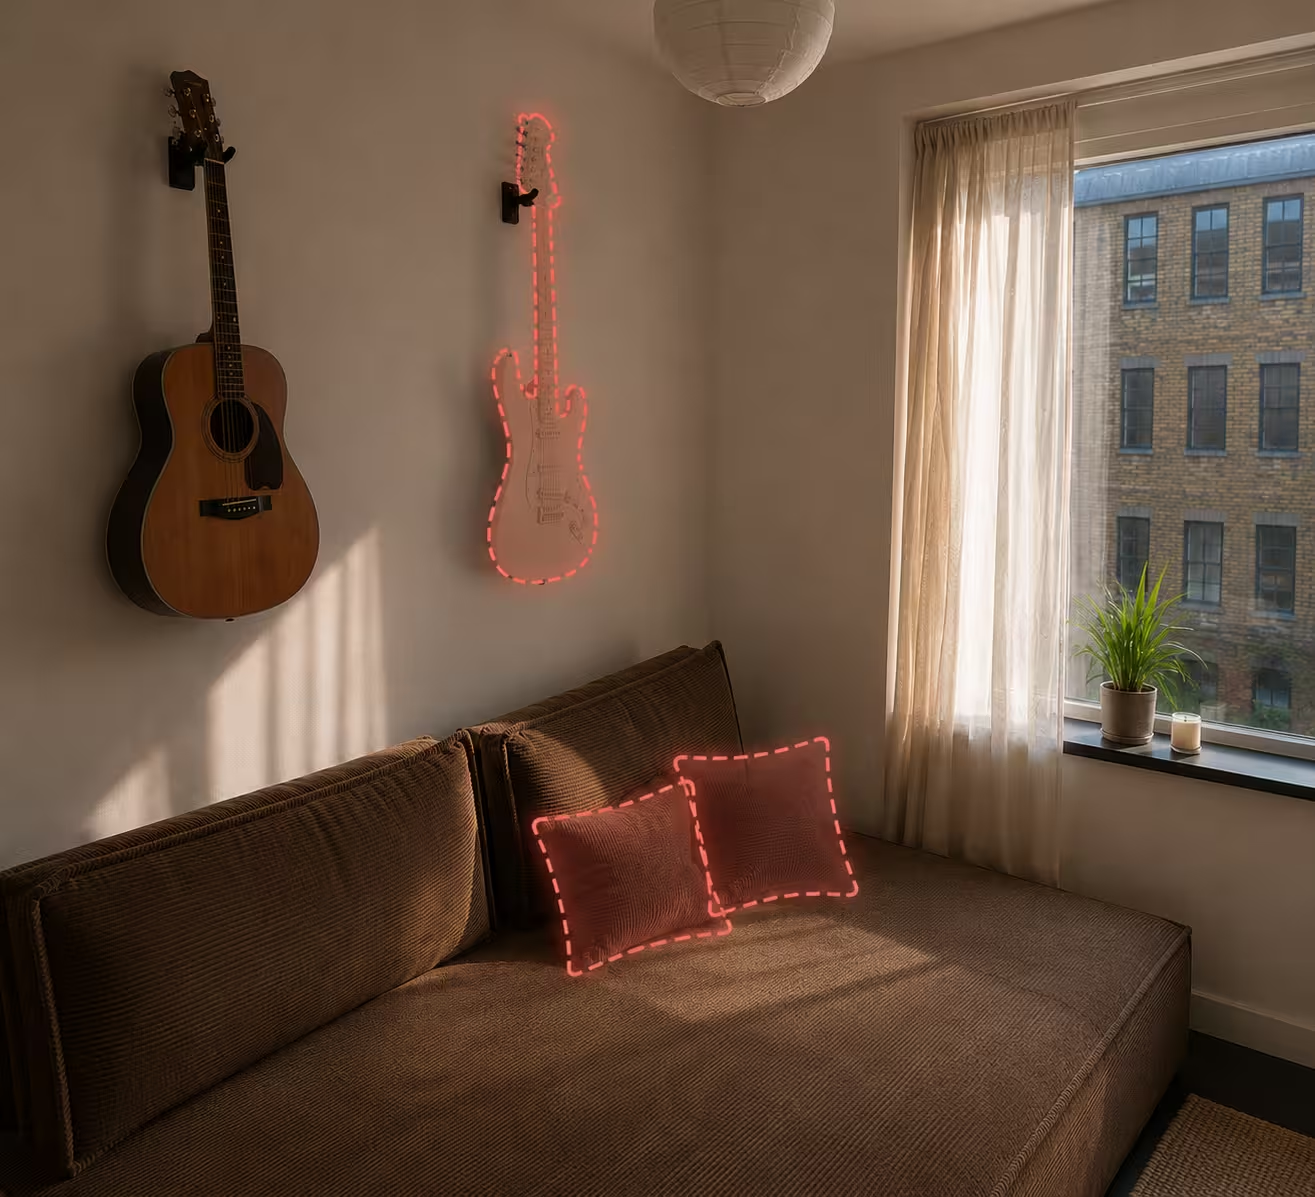
Verify rooms, bathrooms and shared areas before they are released to guests.
The platform brings the photos, verification results, exceptions and follow-up actions together in one structured report.
Linen and surfaces passed. Two amenities were missing, so rework was assigned before the room was released.
A record of what was cleaned, by whom, when, and what it looked like at the time. Without an audit trail a cleaning contract comes down to two people disagreeing about a room neither can see any more. Every completed audit keeps the photo alongside the result and the timestamp, so the trail is reviewable months later rather than being one person's word against another's.
Assign the check, capture the evidence on site, apply the decision rule, and keep the record. The audit is not the photograph – it is the sequence around it: who was asked, what came back, whether it met the standard, and what happened when it did not. A proof-of-clean process only holds up later if each of those steps left something behind.
The submitted image goes to the AI cleanliness evaluator, and the workflow acts on what comes back. That split matters operationally: the assessment answers what the photo shows, and the workflow decides what happens next – release the space, hold it, raise rework, or escalate. You can change either without touching the other.
It is held rather than passed. The workflow raises the rework, notifies whoever is responsible, and asks for a follow-up audit before the space is released. Holding the room is the part that changes behaviour: a report that arrives next week tells you a room was dirty, whereas a hold stops it being handed to a guest.
Not necessarily, and there are two ways to run it. Most teams use the Tiliter app: the check arrives on the phone the cleaner already carries, they take the photo and see the result, with no score to interpret or form to fill in. If you would rather not introduce another app, the same check runs through the API, so capture can sit inside whatever your teams already use, whether that is a workforce app, a facilities platform or your own build. Either way supervisors set the standard once and the people doing the work just capture what is in front of them.
Hotel rooms and guest turnover, gyms and changing rooms, trains and public facilities, commercial kitchens, offices and shared workspaces, and venues between events. Anywhere a space has to reach a standard before the next person uses it, and somebody currently walks round checking by eye. It runs as part of smart environments more broadly.
A checklist app records that an inspection happened. This is a cleaning verification workflow: the evidence is assessed, and the result drives what happens next. It also closes the loop – rework is raised, assigned and re-audited in the same place, rather than exported to a spreadsheet somebody has to chase.
That is what the record is for. Every audit produces a dated, photo-backed entry attached to the site and the person, so a quarter of evidence can be produced without anyone reconstructing it from memory. Cleaning audit trail software earns its place at exactly that moment, not on the day the work is done.
Yes. The workflow is available end to end in the Tiliter app, and every part of it is also available through the API, so you can take as much or as little of it as you need. Some teams run the whole audit with us. Others keep assignment and scheduling in the system they already have, send the image over for assessment, and take the result back into their own workflow. Results can also be pushed into Slack, Zapier or Microsoft Power Automate if the destination is a notification rather than another system.
Build visual verification workflows and deploy them through mobile, web, cameras or your existing systems. Deployed in thousands of locations worldwide and ready to scale with your operations.